Bahasa Melayu
Anda pernah dengar pasal RSI tapi tak faham macam mana nak guna? Tak perlu risau! RSI, atau Relative Strength Index, ni macam meter penunjuk dalam kereta. Kalau meter minyak dah dekat kosong, kita tahu masa untuk isi minyak. RSI pun sama—dia bagi isyarat bila harga saham atau aset dah terlalu mahal (overbought) atau terlalu murah (oversold).
Bayangkan anda pergi pasar malam. Ada gerai jual durian Musang King dengan harga RM50 sebiji. Hari pertama, ramai orang beli sebab rasa murah. Tapi hari ketiga, harga naik jadi RM100 sebiji. Sekarang, orang mula fikir, ‘Wah, mahal sangat ni!’ Ada yang takut beli, ada yang mula jual sebab nak ambil untung. Itulah overbought—harga dah terlalu tinggi sampai orang takut nak beli lagi.
Sebaliknya, kalau harga durian tu turun jadi RM20 sebiji, orang mula fikir, ‘Wah, murah ni! Masa bagus untuk beli!’ Itulah oversold—harga dah terlalu rendah sampai orang rasa rugi kalau tak beli.
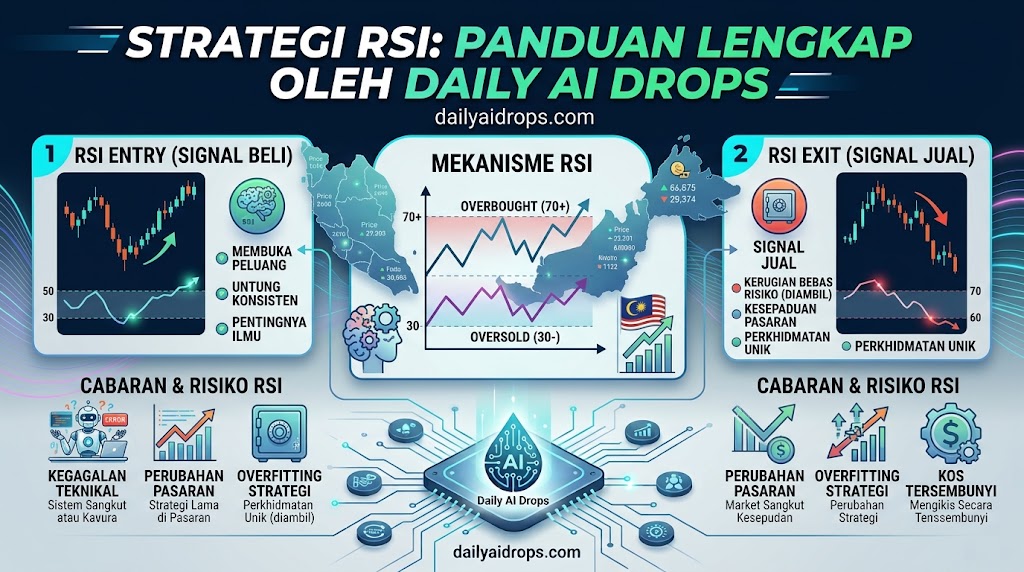
RSI ni ukur ‘kekuatan’ harga dalam skala 0 hingga 100. Biasanya, kalau RSI melebihi 70, itu tanda overbought. Maksudnya, harga mungkin dah terlalu tinggi dan boleh turun balik. Kalau RSI kurang daripada 30, itu tanda oversold. Maksudnya, harga mungkin dah terlalu rendah dan boleh naik balik.
Tapi ingat, RSI ni bukan ramalan ajaib. Dia cuma alat untuk bantu kita buat keputusan. Macam meter minyak dalam kereta—kita kena pandai baca dan faham bila nak isi minyak, bukan tunggu sampai kereta berhenti tengah jalan!
Cara Guna RSI untuk Entry (Beli)
Kalau anda nak beli saham atau aset, tengok dulu RSI. Kalau RSI turun bawah 30, itu mungkin isyarat baik untuk beli. Tapi jangan terus tekan butang beli! Tunggu dulu RSI naik sedikit dari bawah 30, contohnya ke 35 atau 40. Ini untuk pastikan harga dah mula stabil dan tak terus turun.
Contoh: Bayangkan anda nak beli saham syarikat teh tarik terkenal. Harga dah turun lama, dan RSI dah jatuh ke 25. Anda tunggu sehari dua, dan RSI naik ke 35. Ini mungkin masa yang baik untuk beli sebab harga dah mula stabil dan ada potensi untuk naik.
Cara Guna RSI untuk Exit (Jual)
Kalau anda dah pegang saham dan nak jual, tengok RSI. Kalau RSI naik melebihi 70, itu mungkin isyarat untuk ambil untung. Tapi jangan terus jual! Tunggu dulu RSI turun sedikit dari atas 70, contohnya ke 65 atau 60. Ini untuk pastikan harga dah mula stabil dan tak terus naik.
Contoh: Anda beli saham syarikat teh tarik tu pada harga murah, dan sekarang harga dah naik tinggi. RSI dah capai 75. Anda tunggu sehari dua, dan RSI turun ke 65. Ini mungkin masa yang baik untuk jual dan ambil untung.
Tip Tambahan: Jangan Bergantung 100% pada RSI
RSI ni alat yang bagus, tapi dia tak sempurna. Kadang-kadang, dalam pasaran yang sangat kuat (bullish), RSI boleh kekal di atas 70 untuk lama. Sebaliknya, dalam pasaran yang sangat lemah (bearish), RSI boleh kekal di bawah 30 untuk lama. Jadi, selalu gabungkan RSI dengan alat lain macam moving average atau support/resistance untuk keputusan yang lebih tepat.
Macam memandu kereta, kita tak boleh tengok meter minyak sahaja. Kita juga kena tengok cermin, speedometer, dan keadaan jalan. RSI ni salah satu alat dalam kotak alat pelaburan anda. Gunakan dengan bijak!
Kesimpulan
RSI ni macam ‘meter’ untuk bantu anda tahu bila masa yang sesuai untuk beli atau jual. Kalau RSI bawah 30, mungkin masa untuk beli. Kalau RSI atas 70, mungkin masa untuk jual. Tapi ingat, jangan bergantung 100% pada RSI. Gabungkan dengan alat lain dan sentiasa buat kajian sendiri sebelum membuat keputusan.
Selamat berdagang, dan semoga berjaya!
English
Have you heard of RSI but don’t know how to use it? No worries! The Relative Strength Index (RSI) is like the fuel gauge in your car. When the fuel gauge is near empty, you know it’s time to refuel. RSI works the same way—it gives signals when a stock or asset is too expensive (overbought) or too cheap (oversold).
Imagine you’re at a night market. A stall is selling Musang King durians for RM50 each. On the first day, many people buy because it’s cheap. But by the third day, the price has jumped to RM100 each. Now, people start thinking, ‘Wow, that’s too expensive!’ Some hesitate to buy, while others start selling to take profits. That’s overbought—the price is too high, and people are afraid to buy more.
On the other hand, if the price drops to RM20 each, people start thinking, ‘Wow, that’s a bargain! Time to buy!’ That’s oversold—the price is too low, and people feel it’s a great opportunity to buy.
RSI measures the ‘strength’ of a price on a scale of 0 to 100. Usually, if the RSI goes above 70, it’s a sign of overbought. This means the price might be too high and could drop soon. If the RSI falls below 30, it’s a sign of oversold. This means the price might be too low and could rise soon.
But remember, RSI isn’t a magic crystal ball. It’s just a tool to help you make decisions. Like the fuel gauge in your car—you need to know how to read it and understand when to refuel, not wait until your car stops in the middle of the road!
How to Use RSI for Entry (Buying)
If you’re looking to buy a stock or asset, check the RSI first. If the RSI falls below 30, it might be a good signal to buy. But don’t rush! Wait for the RSI to rise slightly above 30, say to 35 or 40. This ensures the price has started to stabilize and isn’t continuing to fall.
Example: Imagine you want to buy shares in a famous teh tarik company. The price has been falling for a while, and the RSI has dropped to 25. You wait a day or two, and the RSI rises to 35. This might be a good time to buy because the price has stabilized and has the potential to rise.
How to Use RSI for Exit (Selling)
If you already own a stock and want to sell, check the RSI. If the RSI rises above 70, it might be a signal to take profits. But don’t sell immediately! Wait for the RSI to drop slightly below 70, say to 65 or 60. This ensures the price has started to stabilize and isn’t continuing to rise.
Example: You bought shares in that teh tarik company at a low price, and now the price has risen significantly. The RSI has reached 75. You wait a day or two, and the RSI drops to 65. This might be a good time to sell and take your profits.
Additional Tip: Don’t Rely 100% on RSI
RSI is a great tool, but it’s not perfect. Sometimes, in a very strong market (bullish), the RSI can stay above 70 for a long time. Conversely, in a very weak market (bearish), the RSI can stay below 30 for a long time. So, always combine RSI with other tools like moving averages or support/resistance for more accurate decisions.
Like driving a car, you can’t just look at the fuel gauge. You also need to check your mirrors, speedometer, and the road conditions. RSI is just one tool in your investment toolbox. Use it wisely!
Conclusion
RSI is like a ‘gauge’ to help you know the right time to buy or sell. If the RSI is below 30, it might be time to buy. If the RSI is above 70, it might be time to sell. But remember, don’t rely 100% on RSI. Combine it with other tools and always do your own research before making decisions.
Happy trading, and good luck!